Where is COG for Vector?
In March, Jed described the “Naïve Origins of Cloud Optimized GeoTIFF” – an access pattern and ecosystem that revolutionized data delivery for AWS, its customers, and the public sector.
COG is an established technology for producing and consuming imagery, but there’s a missing half of geospatial: vector data. Organizations that work with imagery are wrangling vectors, too: consider building footprints, tasking areas, parcels, agricultural plots, and ML labels. COG’s accessibility advantages ought to carry over to vector workflows.
Bringing COG’s benefits to vector data is a design goal of PMTiles, a cloud-native format for visualization with tile pyramids. It’s meant to be a useful complement – not alternative – to COG, GeoParquet and FlatGeobuf.
What makes COG special
The key differences between COG and Regular Old GeoTIFF are internal tiling and overviews.
- Internal tiling enables clients to access the parts they need instead of the whole file, a “window” or area of interest.
- Overviews are key for enabling the astronaut’s eye view of entire datasets. Downloading an overview over HTTP can take less than a second, instead of transferring the entire dataset.
This combination enables access via Range Requests on commodity object storage, making applications simple to build and deploy.
Another feature of COG is backwards compatibility. Adoption is effortless, since applications that read GeoTIFF, read COG. But backwards compatibility is also a limitation: COG works only for data represented by pixels.
Cloud-Native Vector Formats
Two emerging solutions for cloud-native vector are FlatGeobuf and GeoParquet.
- FlatGeobuf is a row-oriented file format for Simple Features developed by Björn Harrtell. Consider it a “Shapefile that doesn’t stink”. It has cloud-friendly design elements: the internal organization allows efficient HTTP Range Requests, and it has a spatial index to access a subset of rows remotely.
- GeoParquet differs from FlatGeobuf in its columnar layout. This results in smaller files since feature attributes are compressed together in blocks. It’s ideal for access patterns that scan the entire feature set. Like COG, it has interoperability with existing tools and workflows.
Limitations
Both FlatGeobuf and GeoParquet qualify as cloud-native vector formats. Neither format has internal tiling or overviews, which limits their usefulness for certain applications:
If a dataset consists of points, or uniformly-sized polygons like buildings, a spatial index is as good as internal tiling. But a dataset with irregularly sized features is more difficult to deal with. If a single feature contains 10,000 vertices – like the complex boundary of a protected wildlife area – any queries that touch this feature fetch the entire vertex sequence.
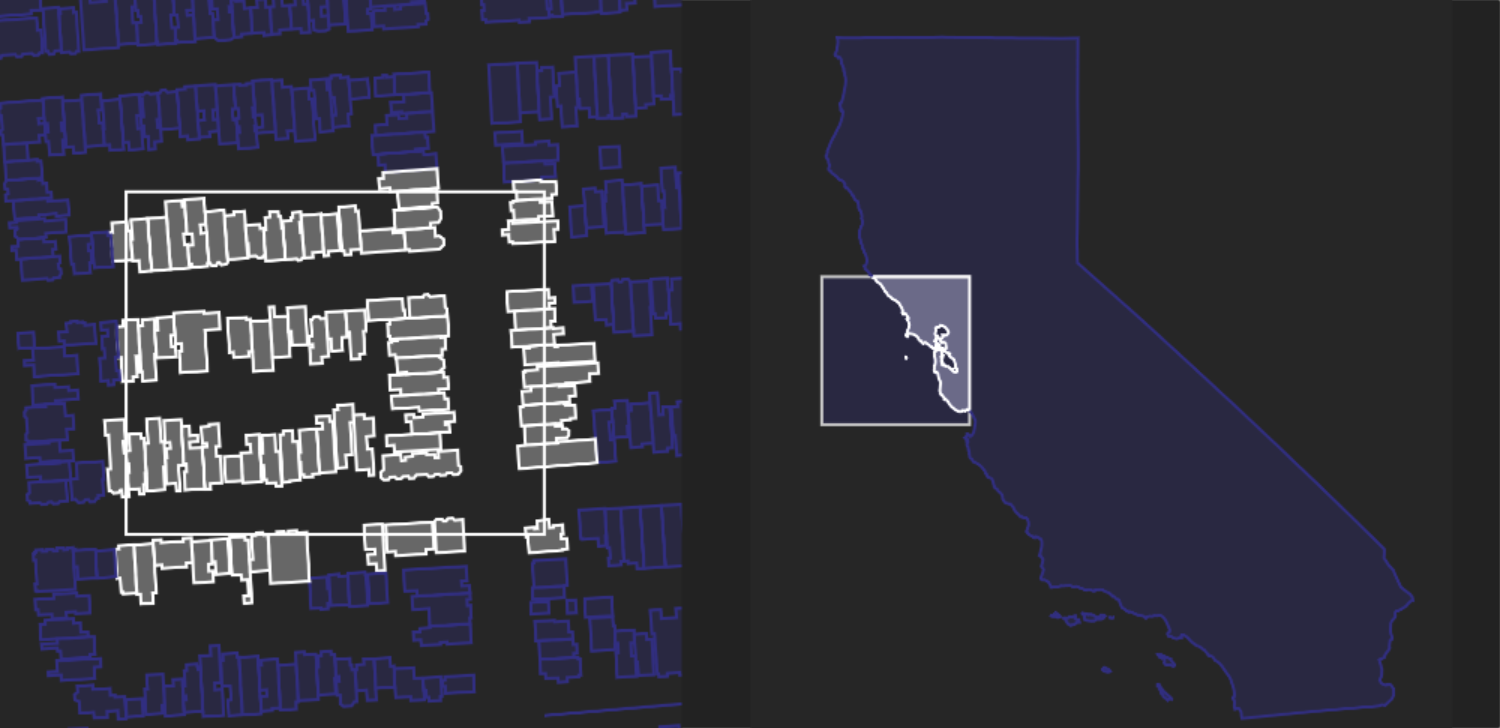
Spatial indexing applied to features of different sizes
Tiling a COG is obvious, since the pixels are gridded. But tiling of a vector dataset involves non-trivial clipping of polygons into bite-sized parts.
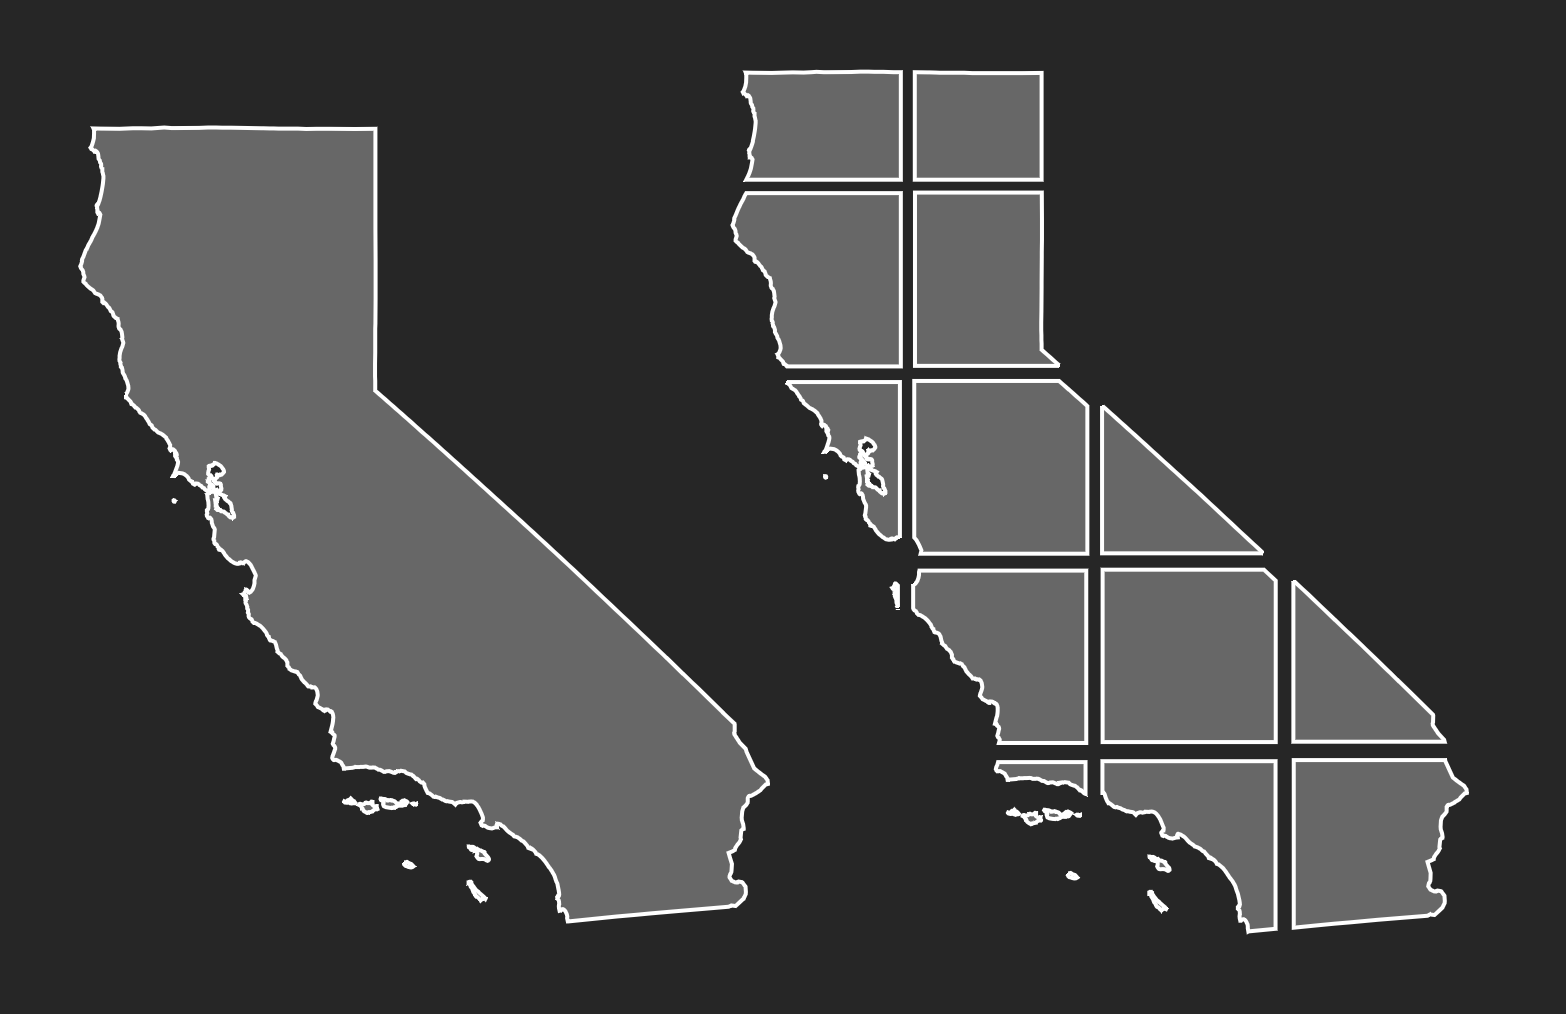
Clipping a vector shape into tiles
What about overviews? COG has an obvious strategy: each overview downsamples by 2, with well-known resampling.
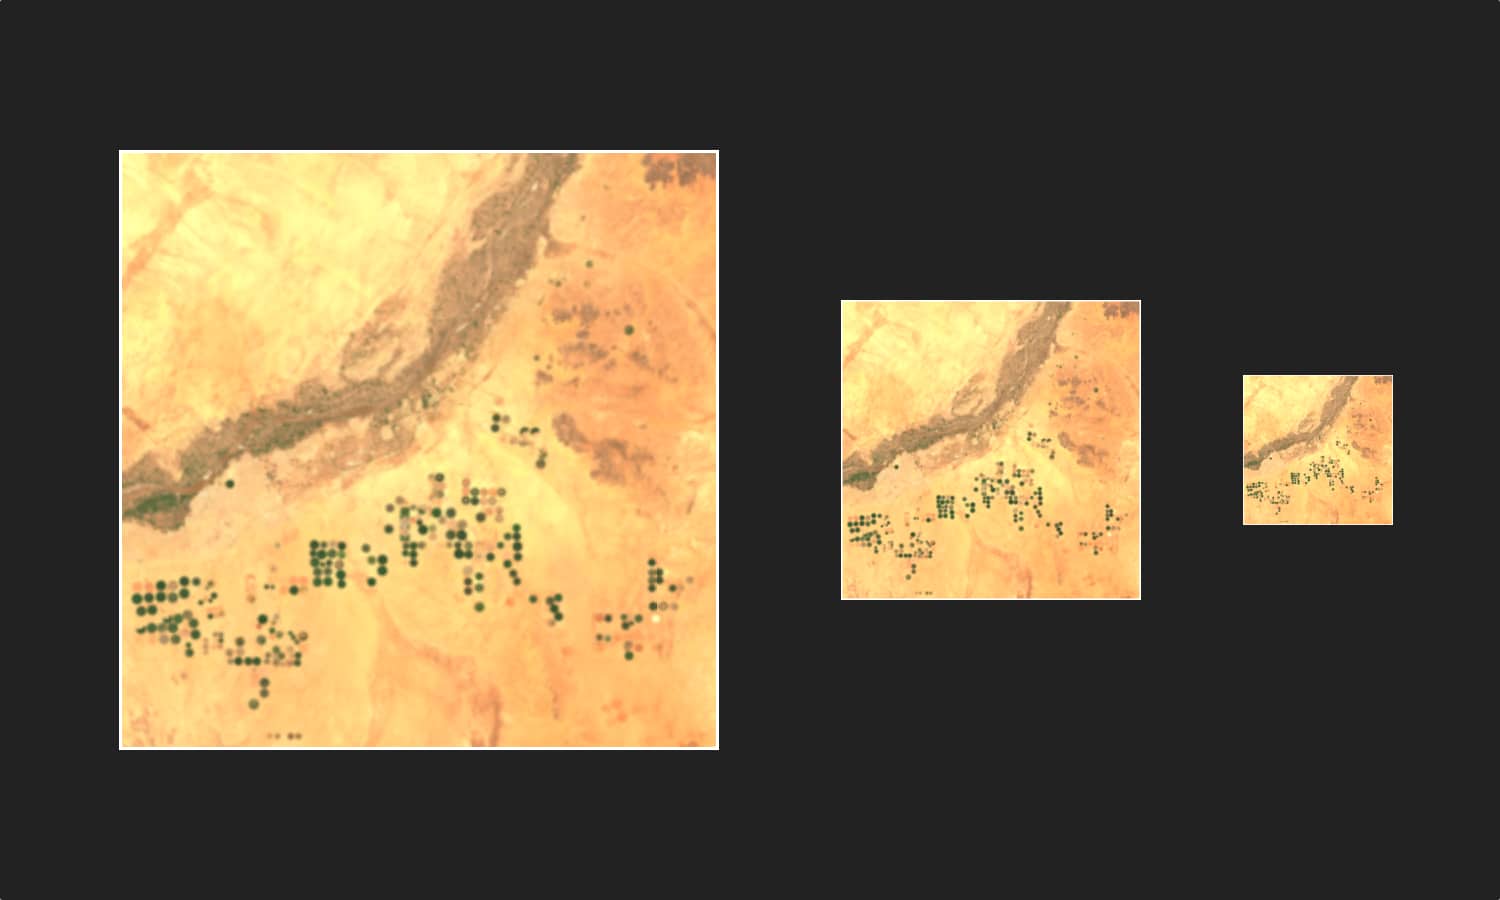
Building raster overviews
What is an overview for vector? It’s essential for the astronaut’s eye view – a view of the whole dataset on a map. The solutions are ad-hoc: you could create duplicate, simplified versions of every feature and attributes specifying which zoom level to appear at. But that approach doesn’t solve which features to eliminate, since including every feature in a million-row dataset for zoom 0 is impossible.
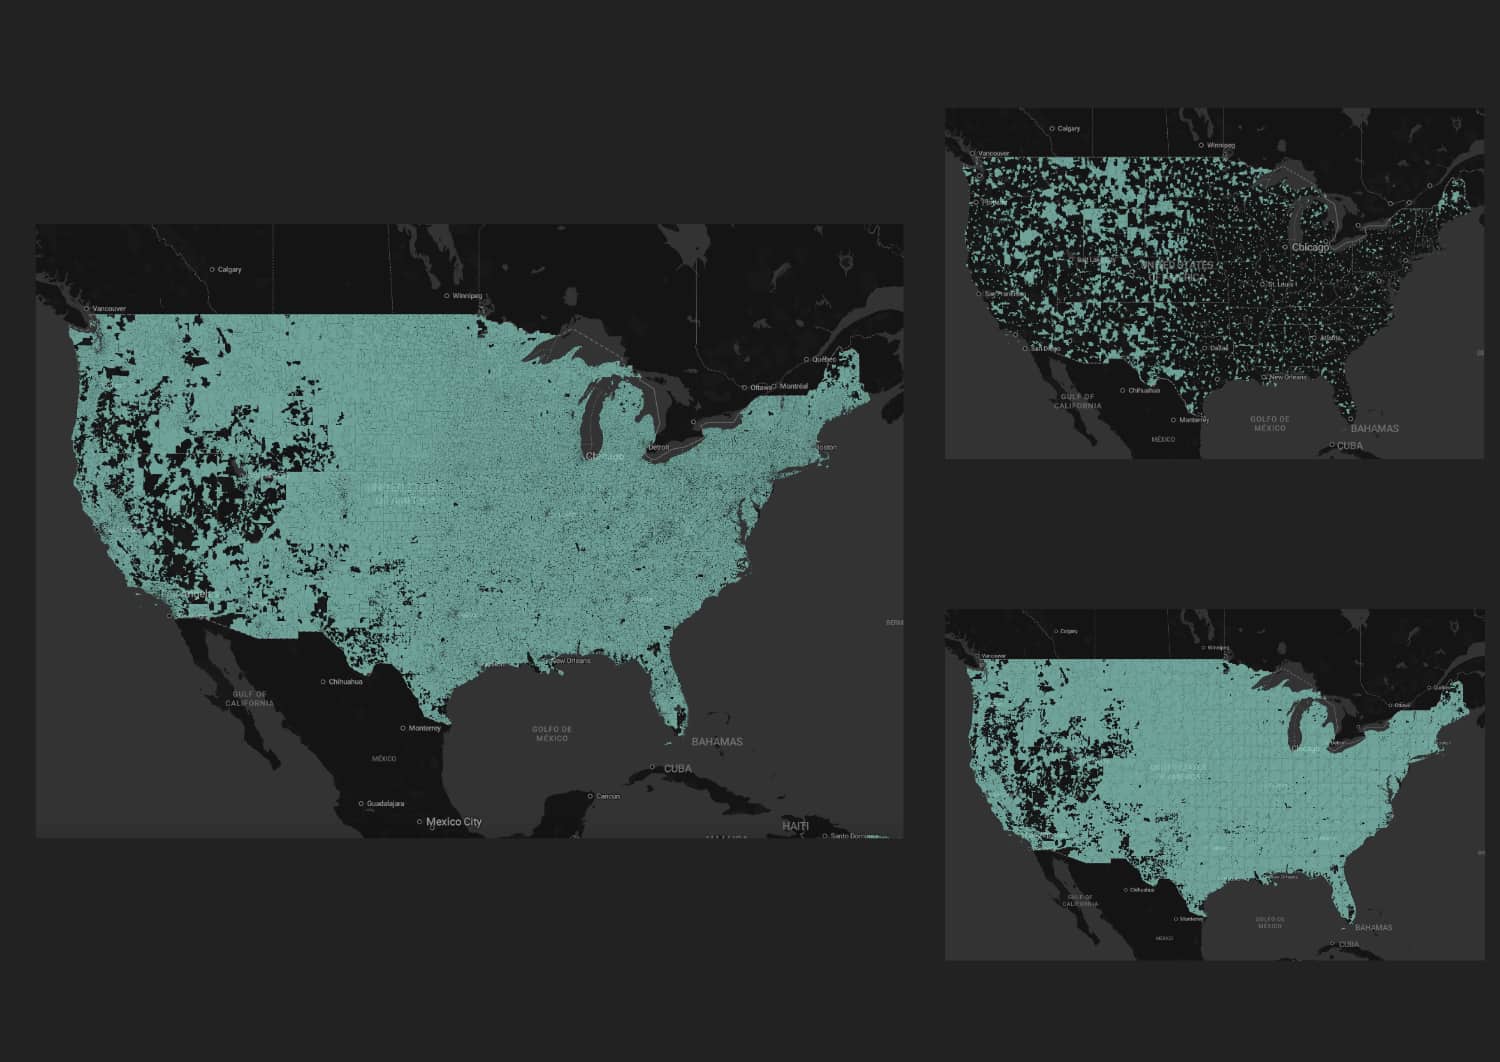
Different strategies for building vector overviews - dropping vs. merging. Basemap © OpenStreetMap
FlatGeobuf and GeoParquet are analysis-focused formats. They’re useful for answering queries like What is the sum of attribute A over features that overlap this polygon? But their design does not enable cloud-native visualization like COG does.
The Vector Tile
Tiling and overviews of vector data is best accomplished with vector tiles. The de-facto standard, implemented by PostGIS and GDAL, is the open MVT specification by Mapbox – an SVG-like format using Protocol Buffers.
The best-in-class tool for creating vector tiles from datasets like FlatGeobuf and GeoParquet is tippecanoe, originally developed by Mapbox, but since v2.0 maintained by Felt. Tippecanoe doesn’t just slice features into tiles, it generates smart overviews for every zoom level matching a typical web mapping application. It adaptively simplifies and discards features, using many configuration options, to assemble a coherent overview of entire datasets with minimal tile size.
The last missing piece is a cloud-friendly organization of tiles enabling efficient spatial operations. This is the focus of my PMTiles project, an open specification for COG-like pyramids of tiled data, suited to planet-scale vector mapping. PMTiles, along with similar designs like TileBase and COMTiles, can be read directly by web browsers, meaning they work great as items referenced in SpatialTemporal Asset Catalogs.
Demo
Chris Holmes’ Google Open Buildings dataset on Source Cooperative contains GeoParquet files for different administrative regions.
Using Planet’s gpq command line tool to read the Cairo dataset, in concert with Tippecanoe:
gpq convert Cairo_Governorate.parquet --to=geojson | tippecanoe Cairo.geojson -o Cairo.pmtiles
The 105 MB GeoParquet input turns into a 54MB PMTiles archive, which can then be dropped directly into the PMTiles Viewer:
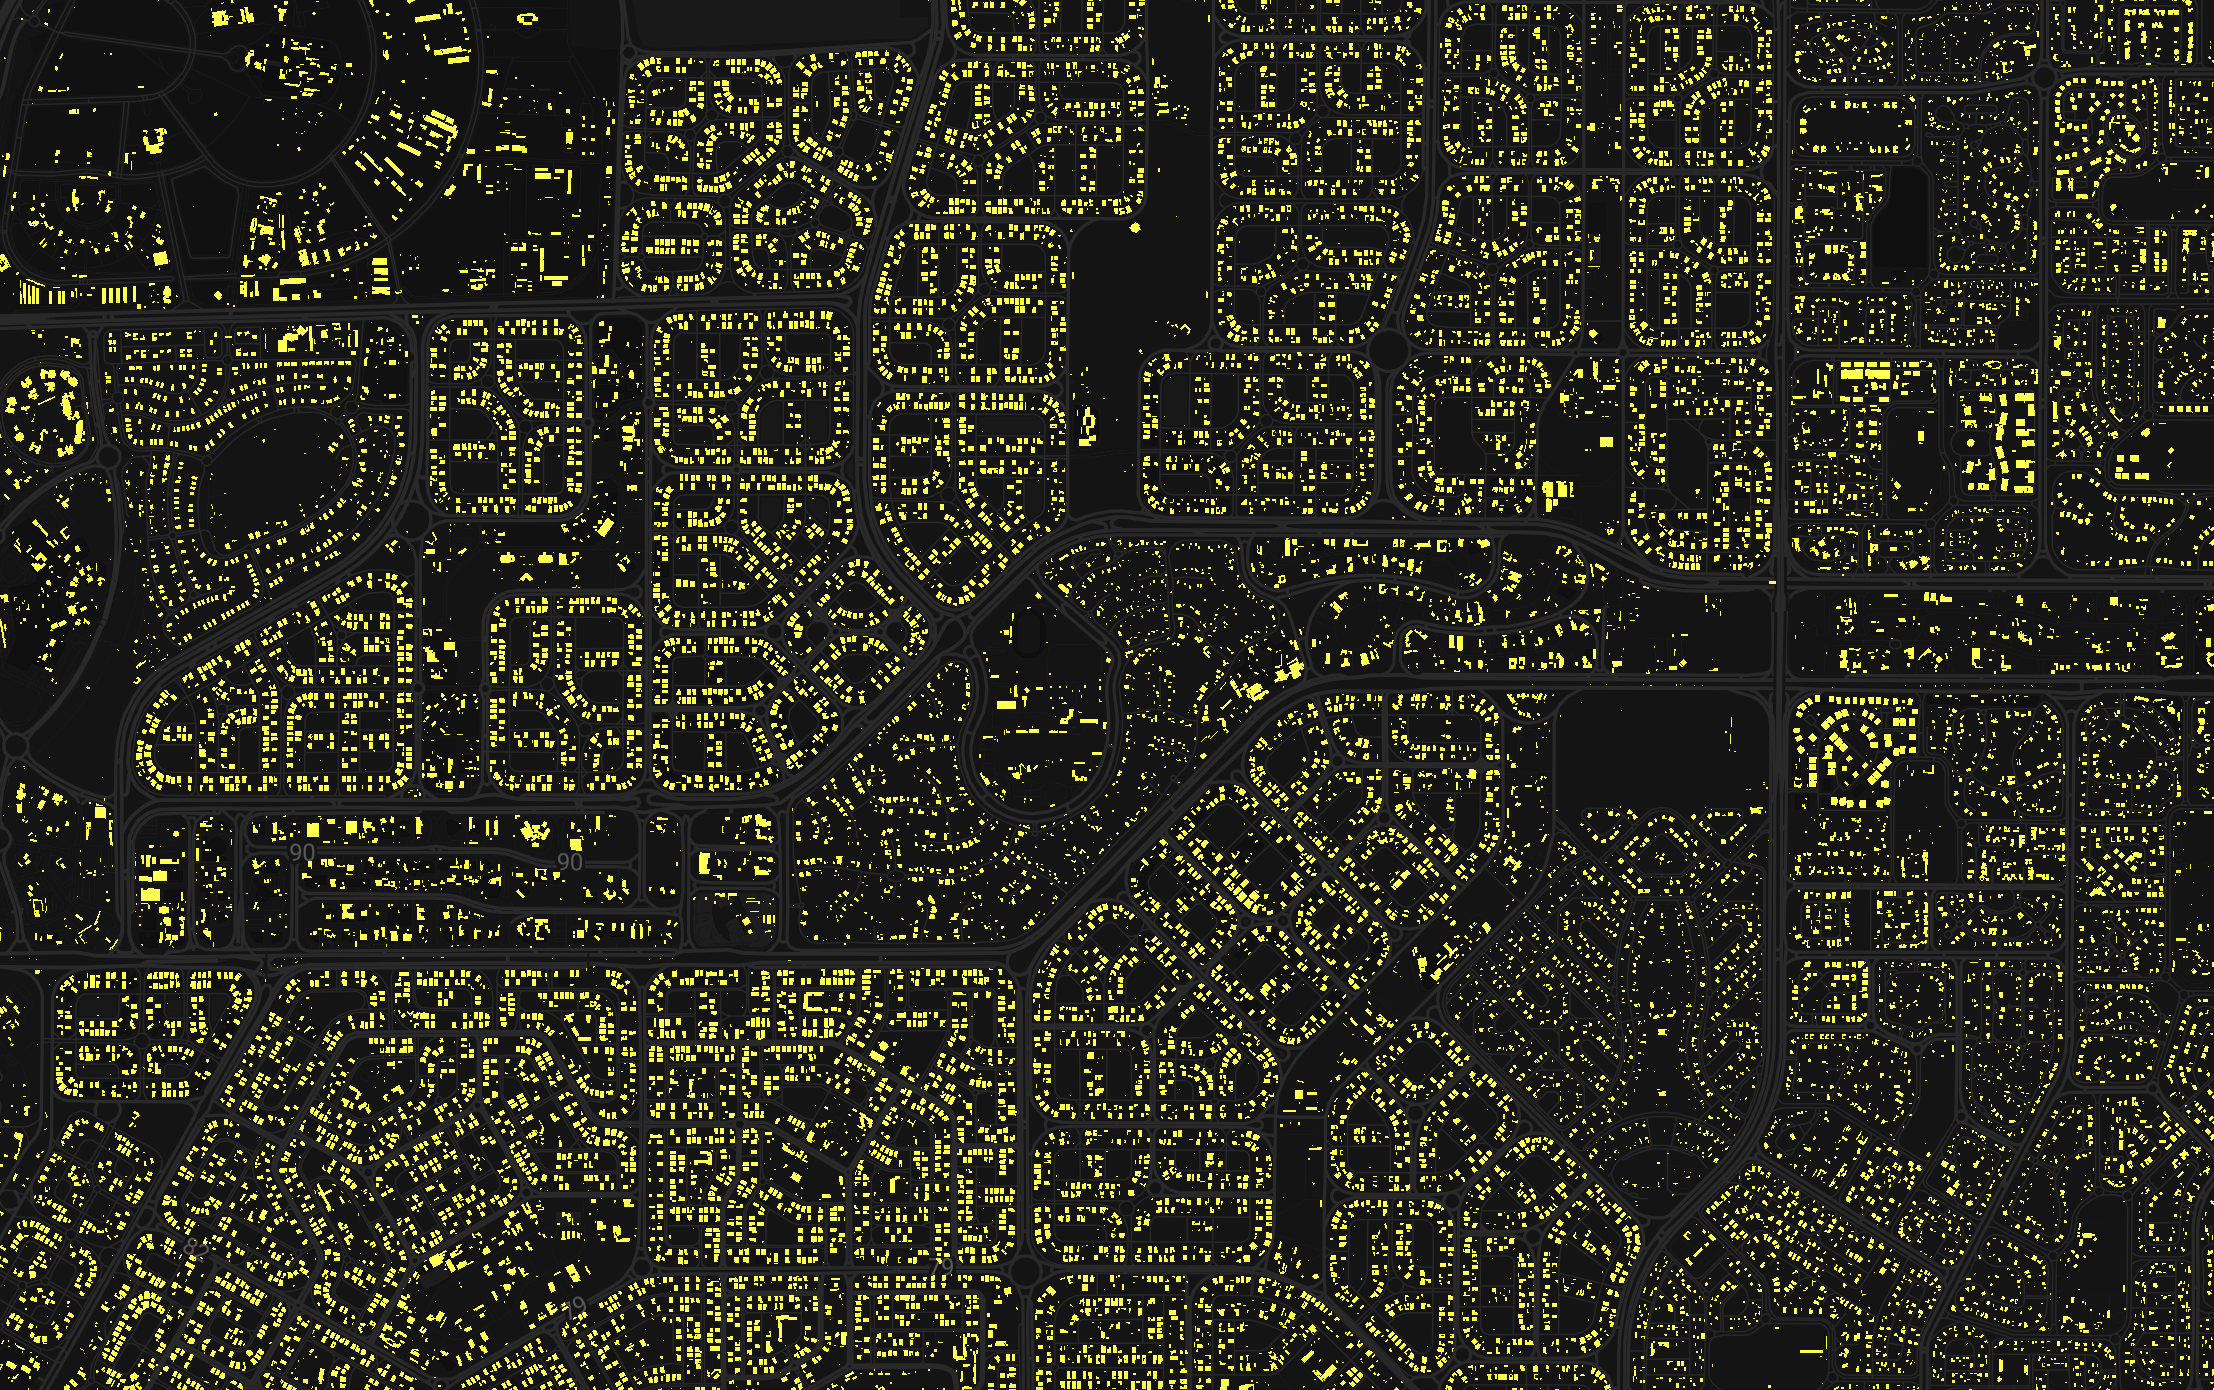
GeoParquet turned into PMTiles for visualization. Source: Google Open Buildings via Source Cooperative.
This 54MB archive can be stored on S3 and enables simple deployment of interactive visualizations – a useful complement to analysis-focused vector formats.
Learn More
PMTiles is the foundation of the Protomaps open source project – an ecosystem of tools, libraries and data for geospatial visualization. Protomaps publishes its datasets to Source Cooperative, and helps organizations of all sizes transition to cloud-native mapping. It’s supported through commercial development projects, a fellowship through the Cloud-Native Geospatial Foundation, and GitHub Sponsors. You can learn more at protomaps.com.
Our blog is open source. You can suggest edits on GitHub.